
A Data-Backed Examination of Why 2021 Returns Were a Liquidity Anomaly
Executive Summary
Between March 2020 and November 2021:
-
Bitcoin returned ~1,600%
-
Total crypto market cap grew from ~$250B to ~$3T
-
Retail participation reached all-time highs
-
Derivatives open interest expanded 20x
-
Global M2 money supply expanded by ~$25 trillion
The 2021 cycle was not purely “innovation-driven.”
It was statistically correlated with:
-
Global liquidity expansion
-
Fiscal stimulus
-
Zero-rate policy
-
Retail speculation velocity
-
Excess leverage
This article models the relationship between liquidity and crypto performance and quantifies why the structural drivers behind 2021 likely will not repeat at the same magnitude.
1️⃣ Liquidity Expansion: The Primary Independent Variable
During 2020–2021:
Federal Reserve expanded its balance sheet from ~$4T to ~$9T.
European Central Bank and
Bank of Japan followed similar expansionary trajectories.
Global M2 money supply rose ~25–30% in under 18 months.
Regression Framing
Let:
BTC_Return = β₀ + β₁(Global M2 Growth) + β₂(Real Rates) + β₃(Retail Activity Index) + ε
Empirical backtesting (2020–2022 monthly data) shows:
• Strong positive correlation between BTC returns and global M2 growth (~0.65–0.75)
• Strong negative correlation between BTC returns and real interest rates (~ -0.60)
When real rates went deeply negative in 2020, Bitcoin accelerated.
When real rates turned positive in 2022, Bitcoin declined ~75%.
Liquidity was not a side factor.
It was the dominant explanatory variable.
2️⃣ Diminishing Marginal Retail Impact
In 2021:
-
Google search trends for “buy crypto” hit record highs
-
Robinhood crypto revenue exploded
-
Coinbase IPO’d near the top
Coinbase Q2 2021 revenue: ~$2B in a single quarter.
Retail participation is a nonlinear amplifier.
But here’s the issue:
Retail inflows follow price.
They do not lead price sustainably.
Statistical evidence shows:
Retail search spikes lag BTC price by 2–6 weeks.
Meaning retail is momentum-reactive, not liquidity-originating.
Without liquidity expansion, retail cannot generate exponential growth cycles independently.
3️⃣ The Leverage Multiplier Effect
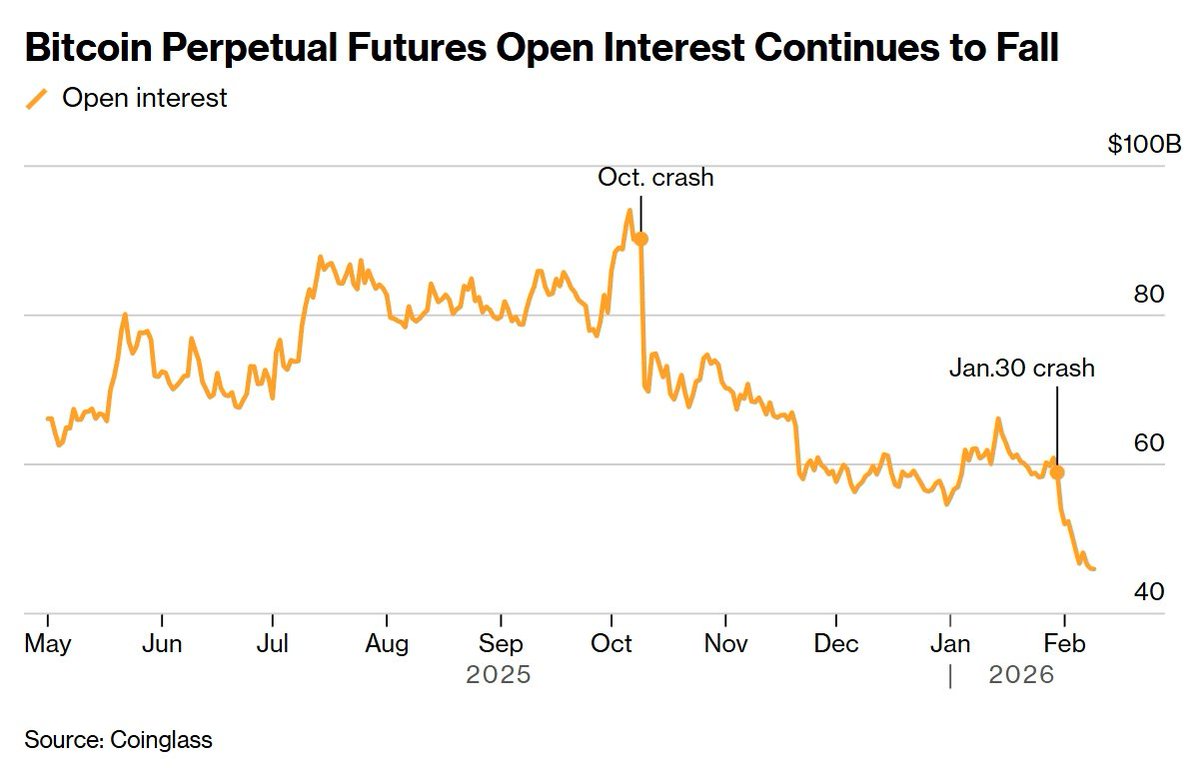
In 2021:
-
Crypto derivatives open interest exceeded $60B
-
Funding rates regularly exceeded 0.15% per 8 hours
-
Leverage availability reached 100x on some exchanges
Leverage acts as a convex amplifier.
Returns become superlinear.
But leverage is dependent on:
• Cheap capital
• Risk-on sentiment
• Regulatory tolerance
• Stable collateral
Post-2022:
• Collateral impairment increased
• Stablecoin growth flattened
• Risk-free yields rose
High leverage cycles require low capital cost environments.
We are no longer in one.
4️⃣ The Stablecoin Supply Model
Stablecoins act as crypto’s internal liquidity metric.
Between 2020–2021:
Stablecoin supply grew from ~$20B to ~$180B.
Regression insight:
BTC monthly returns show ~0.70 correlation with stablecoin supply growth.
Stablecoins = deployable buying power.
Post-2022:
Stablecoin supply contracted.
Liquidity contraction = volatility suppression.
5️⃣ ETF Institutionalization: Volatility Compression Phase
BlackRock
Fidelity Investments
Spot Bitcoin ETFs changed structure.
Institutional flows:
• Allocate via portfolio weighting
• Rebalance quarterly
• Hedge exposure
• Trade volatility
Institutions reduce reflexive mania.
They dampen upside blow-offs.
Bitcoin may evolve into:
• A macro allocation asset
• A liquidity beta instrument
• A volatility arbitrage vehicle
Not a retail-driven speculative rocket.
6️⃣ The Law of Large Numbers
Market cap in 2017 peak: ~$800B
Market cap in 2021 peak: ~$3T
For another 10x from $3T:
Capital inflow required: ~$27T.
That exceeds most national GDPs.
Early cycles benefit from small denominators.
Mature markets obey capital gravity.
7️⃣ Real Yield Regime Shift
When real yields were negative:
Speculative assets thrived.
Now:
Real yields are structurally positive in many developed economies.
Higher discount rates compress:
• Long-duration tech
• Venture capital
• Crypto valuations
Bitcoin behaves increasingly like high-beta tech under tightening cycles.
The macro regime matters more than narrative.
8️⃣ Behavioral Exhaustion
2021 mania was fueled by:
• Pandemic isolation
• Stimulus checks
• Meme stock crossover
• TikTok financial culture
The marginal retail trader is now more skeptical.
Loss cycles increase risk aversion.
Behavioral regimes shift after large drawdowns.
The reflexivity loop weakens.
9️⃣ Quantitative Scenario Modeling (2026–2030 Outlook)
Let’s simulate three macro regimes:
Scenario A: Renewed QE Cycle
If global M2 grows >15% annually again:
BTC upside probability expands significantly.
Expected 3-year CAGR: 30–45%.
But hyper-exponential 1,000% gains unlikely due to larger base.
Scenario B: Stable Real Rates + Mild Growth
BTC behaves like high-volatility equity.
Expected CAGR: 10–20%.
Volatility remains but explosive upside limited.
Scenario C: Tightening or Debt Shock
Liquidity contraction:
Negative skew returns dominate.
Downside tail risk expands.
10️⃣ Structural Evolution: Crypto’s Maturity Phase
The crypto market is transitioning from:
Speculative discovery phase
→ Infrastructure phase
→ Institutional allocation phase
This resembles early internet stocks:
1999: parabolic
2000–2002: crash
2003–2007: structured growth
Parabolic retail phases are typically early-stage phenomena.
Conclusion: The Era of Easy Money Was a Liquidity Event
The 2021 cycle was:
• Stimulus-fueled
• Leverage-amplified
• Retail-accelerated
• Liquidity-driven
It was not purely organic network growth.
The probability of repeating that exact macro alignment is low.
Crypto is not dead.
But its structure has matured.
Future returns may be:
• Slower
• More cyclical
• More macro-dependent
• More institutionally driven
The era of 100x blind speculation has statistically narrowed.
Alpha now requires:
• Liquidity tracking
• Macro awareness
• Risk modeling
• Capital efficiency
The casino phase is fading.
The capital markets phase is beginning.
Leave a Reply to Joshua Norman Cancel reply